

This blog mainly constructed and built by an Asian passionate technical evangelist and system engineering person- Chris Hoo
June 27 2018
More often than none,network engineers will come across the situation whereby they being task on putting some works to perform testing on proving or simulating a networks environment using traffic generator or tester, mimicking the realistic mixes of traffic profiles scenarios with different network functions and features, traffic testing became vital and even mandatory to test and discover features or bottleneck face in a network
Traffic testing divided into stateless or stateful , throughout the years there's some stateless free open source traffics generator such as iperf, ostinato that contributed by communities however there's challenge finding a full fledged stateful traffics generator, and users always needed to opt for commercial traffic generator which brought them concerns and consideration such as CAPEX Cost, Scale, standardization and flexibility.
Until Cisco Devnet launched Cisco TRex- a fully open source software that can perform full stateful and stateless ( L1-L7) traffic generation using commodity x86 servers and NICs, providing end users and network administrators with option to have an open source full function traffic generator tools instead of just spending cash and money to purchase commercial test gear from vendors . Very cool stuff! Hence in this post i wanted to share a little experimental labbing stuff that i did with Cisco TRex in my virtualbox environment. i am using TRex version v2.41 for this testing
For more detailed information about Cisco TRex , please visit https://trex-tgn.cisco.com/
Now lets move into my installation - I followed the guide from official website https://trex-tgn.cisco.com/trex/doc/trex_vm_manual.html#_trex_inside_virtual_box
I tried to setup everything in virtualbox laptop so that the entire test can be done using a single laptop. So the brief summary steps inclusive of below
1. Download and setup TRex by importing the instance into virtualbox and update TRex to version 2.41 from older version
Download and install the TRex image via http://trex-tgn.cisco.com/trex/ the ova build is on version 1.62 so once you imported the ova file you need to update the TRex into the latest version with the steps below:
$mkdir trex
$cd trex
$wget --no-cache http://trex-tgn.cisco.com/release/latest
$tar -xzvf latest
p/s: Please make sure that the 'Reinitialize the MAC address of all network cards checkbox is not selected during the import of ova file into virtual box
2. Logging into TRex and check basic ports and platform configuration
Once step (1) had completed and finished , turn on the vm by logging into trex for first time by using the credentials of : trex/trex
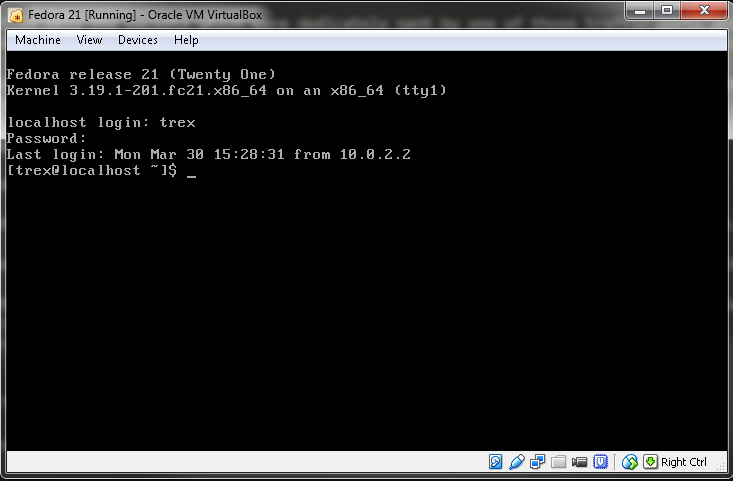
Some of the basic configuration and interfaces status that you can check once u logged in with commands below
$cd /home/trex/v.241
$sudo ./dpdk_setup_ports.py -s
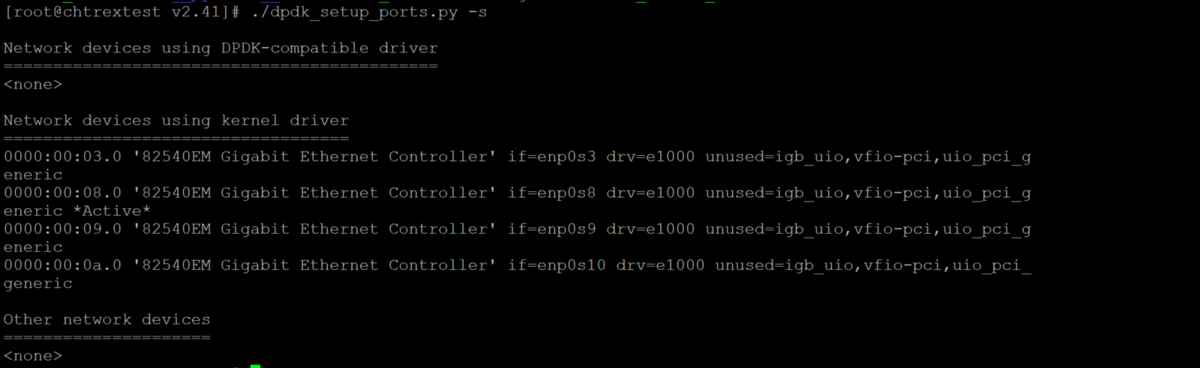
the dpdk_setup_ports.py provide user with information about which NIC that's available for port binding , remember that the NIC with *Active* sign is the management ssh connection NIC, so please don use that to bind into TRex platform configuration file. Separately, the python script will also tell user what kind of NIC drivers that the NICs are using between DPDK and kernel driver
Next i will briefly walk you through the content of /etc/trex_cfg.yaml , this yaml file is the platform configuration file that TRex application will refer to during the initiation of the traffic gen application, by default the system came with a sample configuration file hence user can copy that file and amend the necessarily content from there.
first , copy the config file by issuing command below
$cp cfg/simple_cfg.yaml /etc/trex_cfg.yaml
next , amend trex_cfg.yaml according to your testing topology and setup, mine was a simple TRex to a DUT ubuntu VM that running as a layer 3 forwarding device
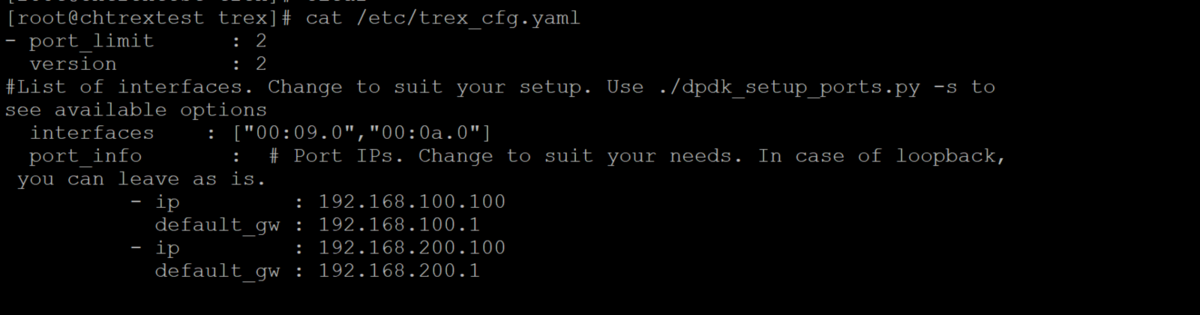
- port_limit refer to the number of ports that TRex server used in the application , default is 2
- version - MUST use 2 , a default value
- interfaces refer to the interfaces that being used for the application , get from the interfaces information that ran by dpdk setup script
- ip refer to ip address refer to the physical interface ip that TRex server is using for port 0 and port 1
-default_gw refer to the next hop device that routing the traffics from network A to network B
There are more configurable options , for full options please refer to TRex user guide
3. Configuring Ubuntu VM as the DUT (Device Under Test)
The DUT in this example as mentioned above is a simple Ubuntu VM instance connected to TRex VM in a single virtualbox hypervisor. Topology will be 2 interfaces on the DUT connected to TRex client and server's interfaces respectively . Basic IP forwarding will be enabled to perform layer 3 forwarding between 2 different networks ( 192.168.100.0 and 192.168.200.0), with a couple of static ARP and static routes to the client and server traffic generator's subnet
Trex client-MAC01----enps09----trex-client-----MAC03-Ubuntu-eth2
Trex server-MAC02----enps10----trex-server-----MAC04-Ubuntu-eth3
Configure the interfaces with an IP on separate subnets
Add the static routes for relevant pcap tests being run from Trex [eg; 16.0.0.0 and 48.0.0.0]. Route to dummy IP towards Trex
source /etc/network/interfaces.d/*
# The loopback network interface
auto lo
iface lo inet loopback
# The primary network interface
auto enp0s3
iface enp0s3 inet dhcp
auto eth2
iface eth2 inet static
address 192.168.100.1
netmask 255.255.255.0
network 192.168.100.0
broadcast 192.168.100.255
up route add -net 16.0.0.0 netmask 255.0.0.0 gw 192.168.100.100
auto eth3
iface eth3 inet static
address 192.168.200.1
netmask 255.255.255.0
network 192.168.200.0
broadcast 192.168.200.255
up route add -net 48.0.0.0 netmask 255.0.0.0 gw 192.168.200.100
$ sudo arp -i enp0s9 -s 192.168.100.100 08:00:27:4B:97:B5
$ sudo arp -i enp0s10 -s 192.168.200.100 08:00:27:DB:5D:0C
configured routing and arp information
[root@chtrextest trex]#:/etc/network$ arp
Address HWtype HWaddress Flags Mask Iface
192.168.200.100 ether 08:00:27:4B:97:B5 CM eth3
192.168.100.100 ether 08:00:27:DB:5D:0C CM eth2
[root@chtrextest trex]#:/etc/network$ route
Kernel IP routing table
Destination Gateway Genmask Flags Metric Ref Use Iface
default 10.0.2.2 0.0.0.0 UG 0 0 0 eth0
10.0.2.0 * 255.255.255.0 U 0 0 0 eth0
16.0.0.0 192.168.100.100 255.0.0.0 UG 0 0 0 eth2
48.0.0.0 192.168.200.100 255.0.0.0 UG 0 0 0 eth3
192.168.100.0 * 255.255.255.0 U 0 0 0 eth2
192.168.200.0 * 255.255.255.0 U 0 0 0 eth3
192.168.0.0 * 255.255.255.0 U 0 0 0 eth1
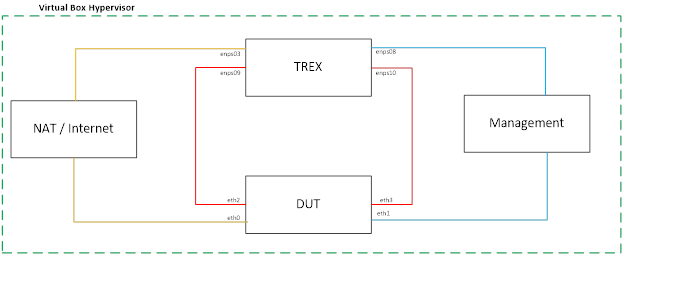
4. virtualbox network testing topology
below with a very simple testing topology that I build in my personal laptop , basically both TRex and DUT contained 4 interfaces each connecting via 3 different networks adapter ( TRex traffic testing , host-only management , NAT interfaces for internet connectivity)
5. Some basic traffics profile testing and results
Once finished with the installation and configuration step 1-3 , next up I proceeded to run some traffics load test with pre-defined .pcap files and yaml configuration files. The files are all located under /trex/v2.41/cap2
[root@chtrextest cap2]# ls
190_packet.pcap exchange.pcap jumbo.yaml rtsp_short.pcap
asa_exploit.pcap http_browsing.pcap lb_ex1.yaml rtsp.yaml
asa_explot1.yaml http_get.pcap limit_multi_pkt.yaml sfr2.yaml
christest.pcap http_plugin.yaml limit_single_pkt.yaml sfr3.yaml
citrix.pcap http_post.pcap mail_pop.pcap sfr4.yaml
cluster_example.yaml http_short.yaml many_client_example.yaml sfr_agg_tcp14_udp11_http200msec_new_high_new_nir_profile_ipg_mix.yaml
cur_flow_single_tw_8.yaml http_simple_ipv6.yaml nat_test.yaml sfr_agg_tcp14_udp11_http200msec_new_high_new_nir_profile.yaml
cur_flow_single.yaml http_simple.yaml Oracle.pcap sfr.yaml
cur_flow.yaml https.pcap per_template_gen1.yaml short_tcp.yaml
delay_10_http_browsing_0.pcap http_very_long.yaml per_template_gen2.yaml sip_short1.yaml
delay_10_rtp_250k_short.pcap http.yaml per_template_gen3.yaml sip_short2.yaml
dns_no_delay.yaml imix_1518.yaml per_template_gen4.yaml smtp.pcap
dns_one_server.yaml imix_64_100k.yaml per_template_gen5.yaml test_pcap_mode1.yaml
dns.pcap imix_64_fast.yaml rtp_160k.pcap test_pcap_mode2.yaml
dns_single_server.yaml imix_64.yaml rtp_250k_rtp_only_1.pcap tuple_gen.yaml
dns_test.yaml imix_9k_burst_10.yaml rtp_250k_rtp_only_2.pcap udp_10_pkts.pcap
dns_tw.yaml imix_9k.yaml rtp_250k_rtp_only.pcap udp_1518B.pcap
dns_wlen1.yaml imix_mimic.yaml rtsp_full1.yaml udp_594B.pcap
dns_wlen2.yaml ipv4_load_balance.yaml rtsp_full2.yaml udp_64B.pcap
dns_wlength.yaml ipv6_load_balance.yaml rtsp_short1_slow.yaml Video_Calls.pcap
dns_wlen.yaml ipv6.pcap rtsp_short1.yaml Voice_calls_rtp_only.pcap
dns.yaml ipv6.yaml rtsp_short2.yaml wrong_ip.pcap
dyn_pyld1.yaml jumbo.pcap rtsp_short3.yaml wrong_ip.yam
The yaml file of TRex applcation contained pcap packet format that's going to use for streams and flows generation. By looking into the packet detail and format by using packet debugging function. Example debugging a SIP packet , command to execute as below
./bp-sim-64-debug -f /cap2/sip_short1.yaml -0 my.erf -v 3
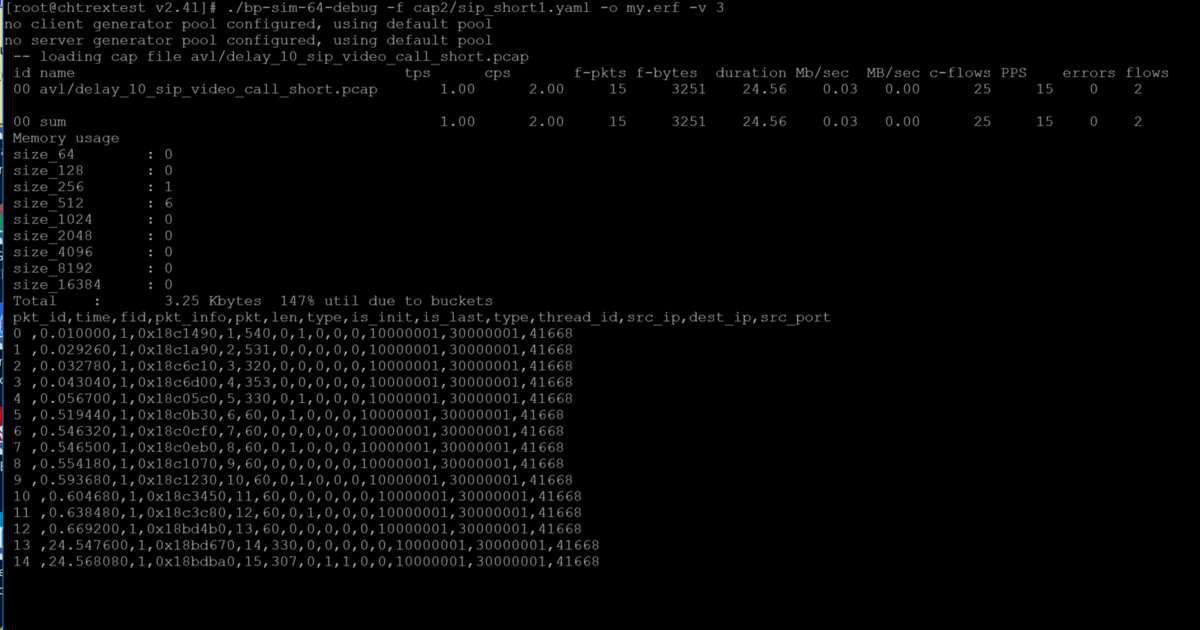
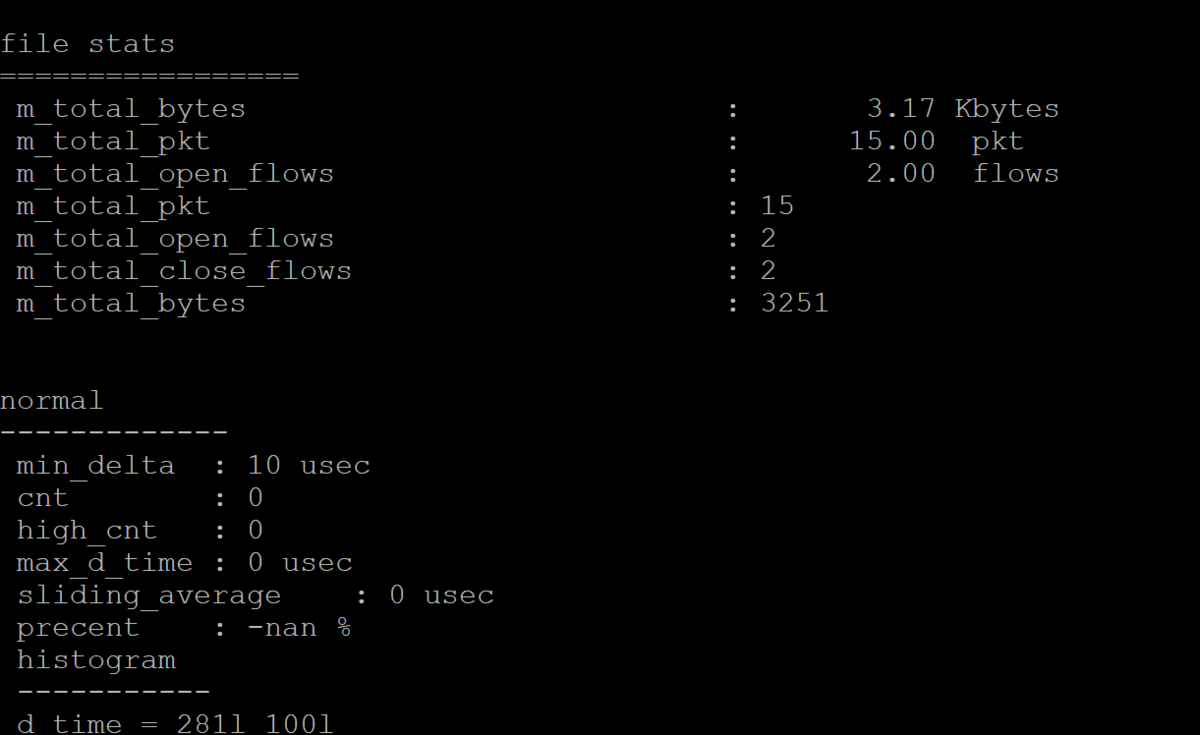
the debugging result explained the packets information that inclusive of transaction per second, connection per second,forwarding packets and bytes , duration , flows tuple information.
Next lets start proceed with traffics loading , I used simple http traffic profile to generate the stream.

The http traffic yaml file contained property information such as below
- Contain 255 clients start from 16.0.0.1 - 16.0.0.255 shown in clients_start and clients_end
- Contain 255 servers start from 48.0.0.1 - 48.0.0.255 shown in servers_start and servers_end
- Contain 255 servers start from 48.0.0.1 - 48.0.0.255 shown in servers_start and servers_end
- capping and measurement the inter packet gap information for traffics stream sending
- using delay_10_http_browsing_0.pcap as packets sample
- 2.776 connection per seconds
- ipg of 10 msec
- rtt of 10 msec
- w representing to simultaneous flows that sent by a client ip , for this config it is only 1 time
Next we can begin to test and monitor the traffics on trex server by running simple command with few parameters below
$ sudo ./t-rex-64 -f cap2/http_simple.yaml -d 10 -m 1 --nc
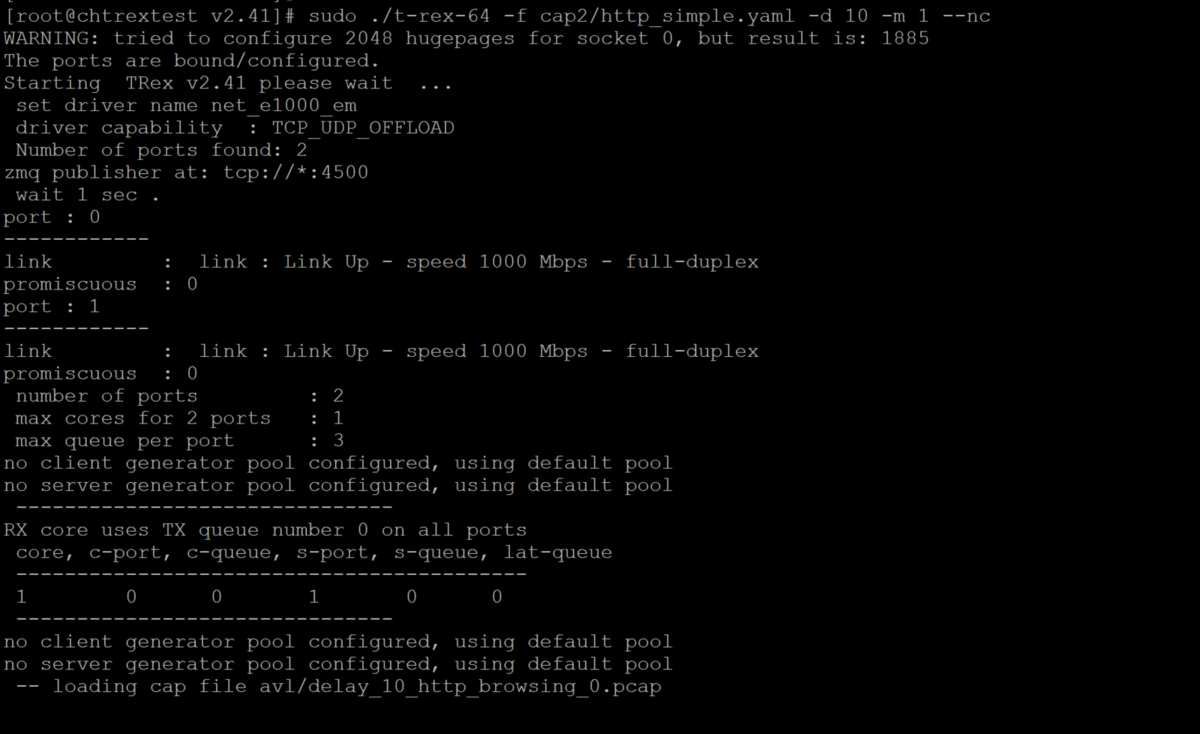
-f is the source yaml file to be used for the test
-d Duration of the test in seconds (minimum is 30)
-m Factor for bandwidth (multiply the CPS of each template in the .yaml file by this number)
--nc If set, will terminate exacly at the end of the duration. This provides a faster, more accurate TRex termination. In default it wait for all the flow to terminate gracefully. In case of a very long flow the termination might be prolong.
-l Run the latency daemon in this Hz rate. Example: -l 1000 runs 1000 pkt/sec from each interface. A value of zero (0) disables the latency check.
-c Number of cores per dual interface. Use 4 for TRex 40Gb/sec. Monitor the CPU% of TRex - it should be ~50%. TRex uses 2 cores for inner needs, the rest of cores can be used divided by number of dual interfaces. For virtual NICs the limit is -c=1.
Once we begin the test we should see the following output
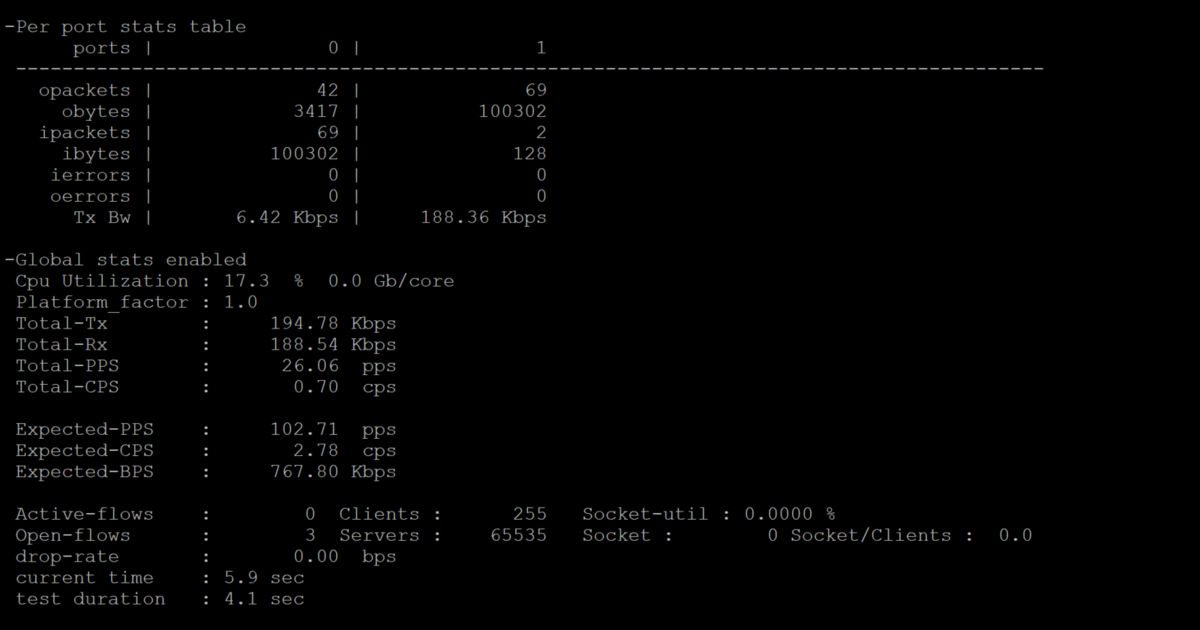
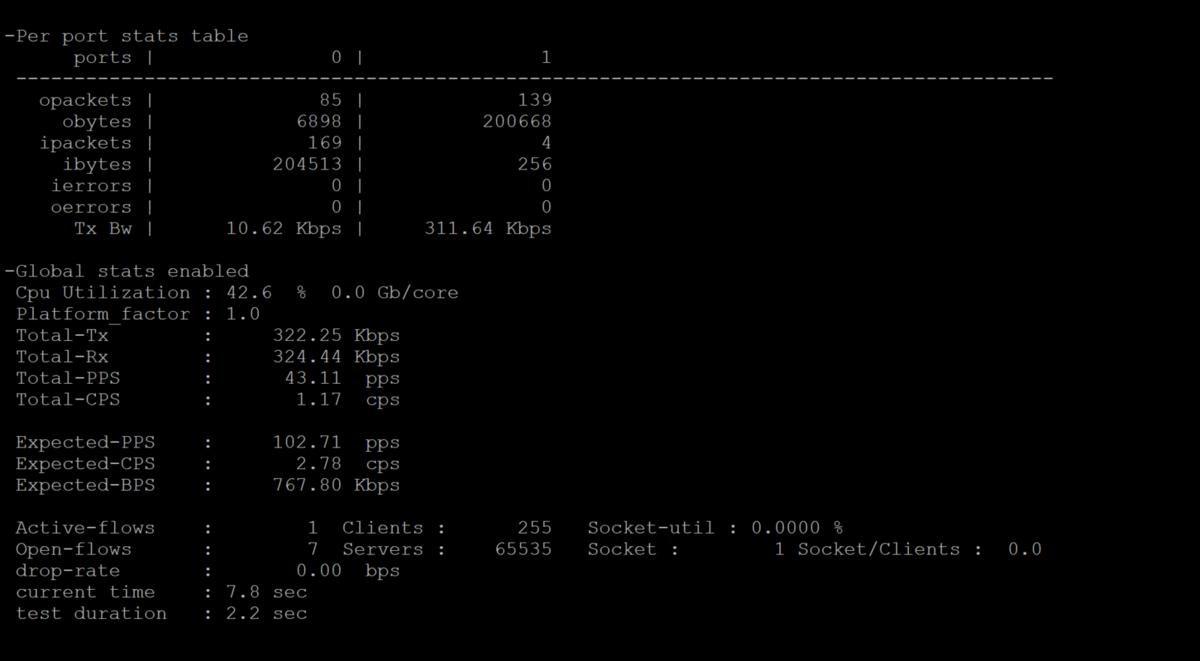
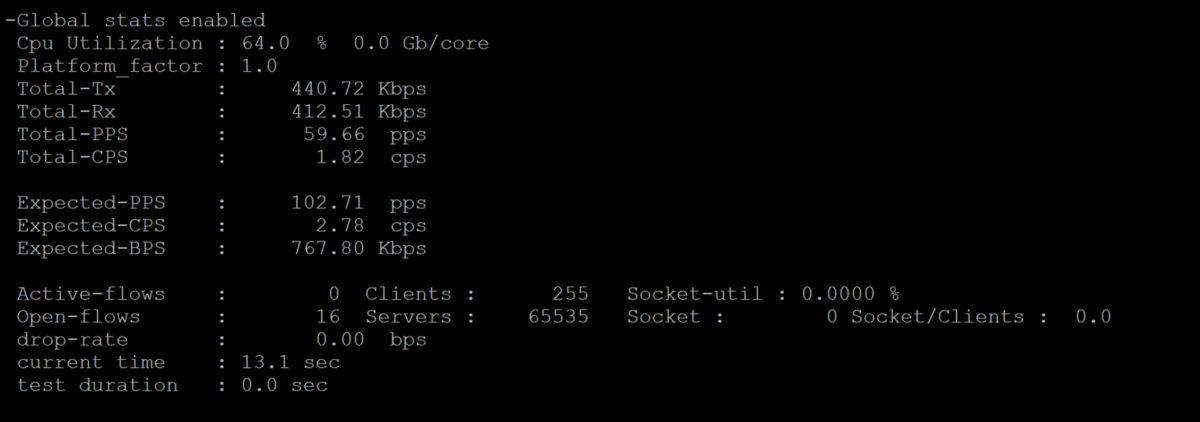
The results shown the true statistics of the test results inclusive of per port and global traffics statistics, number of client , CPS,PPS,drop rate,connections,windows , CPU information on a granular level.
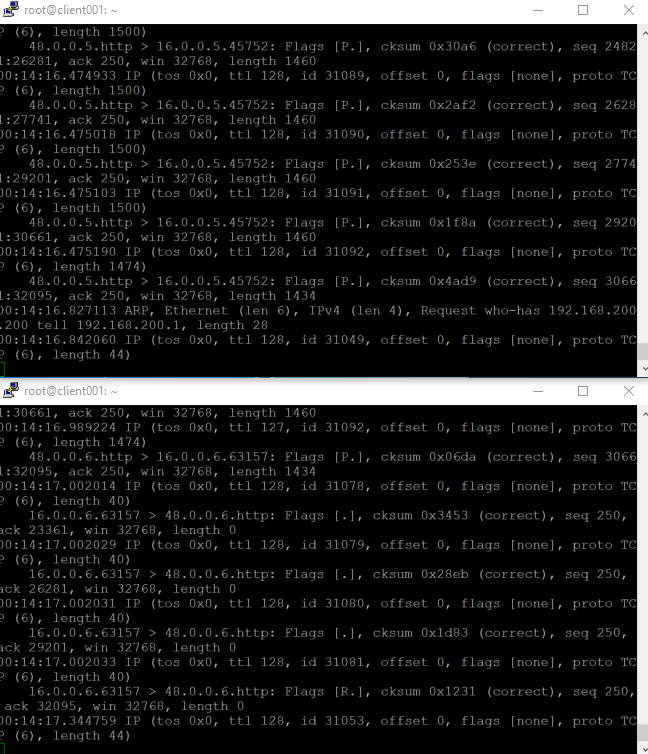
In the same time I did a simple tcpdump on both interfaces that's connected to TRex application server, below with the snapshot taken
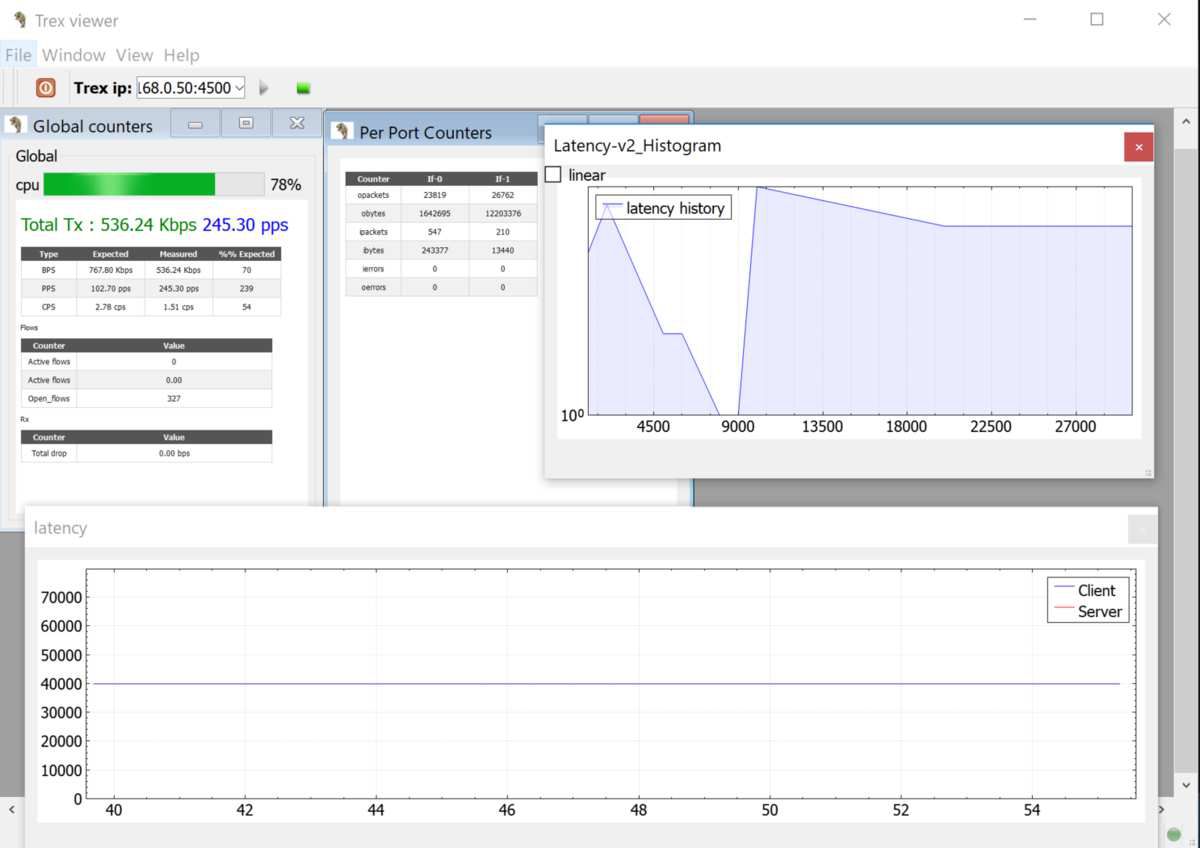
Apart from that , TRex provided user with a TRex viewer app to monitor the statistics and latency or system information through zero mq port 4500 output , sample screenshot taken as below (ignore the latency information as my ubuntu DUT vm were facing some issues during the point when screeshot was taken)
6. Others useful stateful traffic generation features from TRex
Aside from what I had shared above , TRex did have more fancy configuration and options as well as features that available for a more complex and comprehensive testing such as below, this article that i wrote were merely just introduced the basic functions of this great tools, i definitely will continue explore this awesome tool for my upcoming POC and testing simulation
- VLAN dot1q support
- mixing different traffic type and templates
- measuring jitter and latency
- automation that ran through RPC and python API
- client clustering
- IPv6 support
- 200Gbps of scailing
- NAT support etc
- Scapy packets builder


/image%2F2868570%2F20180702%2Fob_0c22b9_pic1.PNG)
/https%3A%2F%2Fassets.over-blog.com%2Ft%2Fcedistic%2Fcamera.png)
/image%2F2868570%2F20180621%2Fob_0af925_5g-functional-layer.png)